Energy Market

Energy Market

Energy Market

Filter

Interval-Data Analysis

$490.00

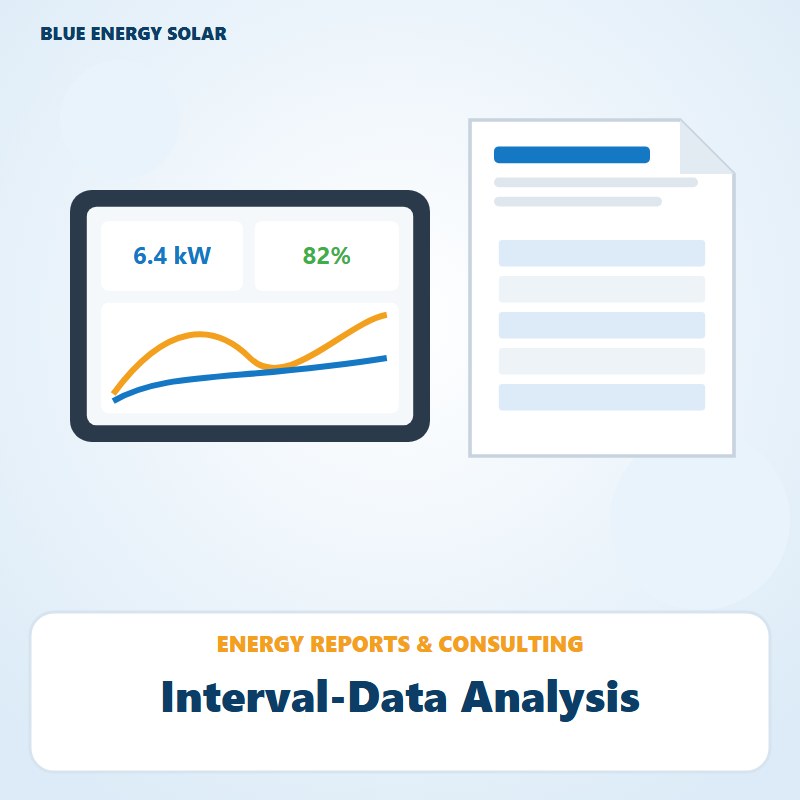
We analyse 12 months of your 15- or 30-minute interval data to show your load profile, baseload, peaks, after-hours waste and how well solar would match your use.

From $490 (12 months of 15/30-minute data), including GST. Indicative starting price: the final fixed price is confirmed in writing after a site assessment.

SKU: BES-CON-10
Brand: Blue Energy Solar
Pack size: 12 months of 15/30-minute data
Form: Digital report
Categories: Business
Share it:

If your business has a smart or interval meter, your electricity use is recorded every 15 or 30 minutes. That data tells a far more useful story than a monthly bill: when the site switches on, what it draws overnight, which days set the peaks and how much power is used after hours when nobody is there. Our Interval-Data Analysis turns 12 months of that data into clear charts and findings you can act on.

The analysis is priced from $490 for 12 months of data as an indicative starting price. Multiple meters or unusual data formats are quoted in writing before we start.

What's included

  • Data check and clean-up, with gaps and estimated reads flagged
  • Average daily load profiles for weekdays, weekends and each season
  • Baseload analysis: what the site draws when it should be quiet
  • Peak analysis: the days and times of your highest demand and their likely causes
  • After-hours waste estimate with practical items to investigate
  • Solar match: how much of a rooftop system's output the site could use on site
  • A digital report with charts and a plain-English summary

Why Blue Energy Solar

We size commercial solar and batteries around interval data, because designing around real consumption gives better results than designing around roof area alone. That means the analysis focuses on the questions that affect investment decisions: how much solar would be used on site rather than exported at low feed-in rates, whether peaks are frequent or rare, and whether the baseload hides equipment that should be switched off. Findings are written for business owners and facilities managers, not just engineers.

Recommended for

Businesses with a smart or interval meter that want to understand when they use power before investing in solar, batteries or efficiency upgrades.

Interval data can usually be requested from your retailer or metering provider, and we explain how if you have not done it before. The analysis shows patterns and estimates, not measured equipment loads, so some findings will point to items to check on site. Where the baseload or after-hours use looks high, a Commercial Energy Audit can confirm the cause.

Feed-in tariffs in NSW are commonly a few cents per kWh, far below what businesses pay for grid electricity. That is why the solar match matters: the more of the output a site uses itself, the stronger the business case typically is.

Directions

1. Request the analysis and tell us about the site's operating hours and major equipment.
2. Send us 12 months of 15- or 30-minute interval data, or ask us how to request it.
3. We check the data, build the load profiles and analyse baseload, peaks and after-hours use.
4. We model how a solar system's output would match your consumption.
5. You receive a digital report and a walkthrough of the key findings.

Warnings

The price shown is an indicative starting price for one meter with 12 months of data; the final fixed price is confirmed in writing in a quote.
The customer must provide the interval data or authorise access to it; incomplete data may limit the findings.
Findings are estimates based on metered data and do not guarantee any saving.
No site visit is included; any on-site investigation is quoted separately.

Frequently Asked Questions

Most businesses with a smart meter have their use recorded in 15- or 30-minute intervals, and sites on a demand tariff generally do. Your bill may mention a smart or interval meter, or a demand charge. If you are unsure, send us a recent bill and we will tell you whether the data is likely to be available and how to request it.

A spreadsheet or CSV export from your retailer or metering provider is ideal. We can also work with the standard metering data files that providers issue. If the file is in an unusual format or covers several meters, we check it before confirming the fixed price, so there are no surprises once the work starts.

It gives a strong starting point. The solar match section shows how much output the site could use at different system sizes, based on your consumption. A final design also needs a roof inspection, shading assessment and switchboard check, which we carry out as part of a site assessment before any solar quote is prepared.

A full year captures seasonal changes such as summer cooling, winter heating and holiday shutdowns, which can change the picture considerably. With less data we can still analyse patterns, but conclusions about peaks and solar match are less reliable, and the report will say so clearly so you can weigh the findings accordingly.
Delivery Options

Service area & scheduling

Where we work

  • Sydney and a radius of roughly 200 km: Newcastle, the Central Coast, Wollongong, the Southern Highlands, the Blue Mountains, Bathurst, Orange, Lithgow, Goulburn and the Canberra region.

Timing

  • Usually delivered within 5-10 business days of receiving a complete 12-month data file.

How your request works

  • Send your request and our team contacts you to arrange the site assessment. You receive a written fixed-price quote before any work starts.
  • All electrical work is carried out by licensed electricians; solar and battery design and installation by SAA-accredited installers.
  • Blue Energy Solar is a New Energy Tech Approved Seller and holds $20 million public liability cover.

Prices include GST.

Review
Please login or register to submit a review.
JoseFernandez
Great product the results are fascinant
02/08/2024 02:59 PM

Energy Market

Call us directly
0421 458 217
Send an Enquiry